Getting Started

Page Summary

On this page we systematically walk through the process of getting started with JADE. We begin with creating an account / logging into sixclear.com and downloading / installing JADE. We then work through opening and running an example to get a feel for the runtime experience in JADE. Finally, we finish with creating an application from scratch and running it to begin appreciating the configuration and customization capabilities baked right into JADE.

Overview

At this point you’ve probably read somewhere that JADE helps you quickly build robust, feature-rich measurement & automation applications. Let’s get JADE installed and see it in action. We’ll start by walking through creating an account (if no already), logging in at sixclear.com, downloading JADE and a JADE Bundle, quickly running an example, and then building & running our own JADE application from scratch.

Create Account & Log In

If you haven’t already, visit create a Sixclear account:

Click the confirmation link sent via email and then login:

You’ll land on the Account page as shown below:

Download JADE (and a Bundle)

Click the MY JADE tab under login which shows the quickstart steps as shown below. Use step 1 to download JADE and step 2 to download the All Latest bundle.

Install JADE

Run the JADE installer with a name similar to jade.x.y.z.installer.exe.

When JADE finishes installing you should find a JADE icon on your desktop. We recommend right-clicking on it and choosing the option to Pin to Taskbar for quick access hereafter.

Launch & Activate JADE

Double-click the JADE icon shown above to launch JADE. If this is your first time launching this version of JADE, the JADE Activation window will display and you’ll be prompted for an activation code for your computer.

Copy the Computer ID and then visit the My JADE page under login at sixclear.com. Scroll down to the computers table and add a computer with your desired name and your Computer ID:

Your computer will now be available in the Licesnses section. Choose your computer name from the dropdown, select the (major) version of JADE you just installed, and click the GENERATE button to generate an activation code for your computer:

Click on the acvivation code to copy it, return to the JADE Activation screen to add your activate code:

Note: you can always return to the JADE Activation window by selecting Install >> Activate... in the menu.

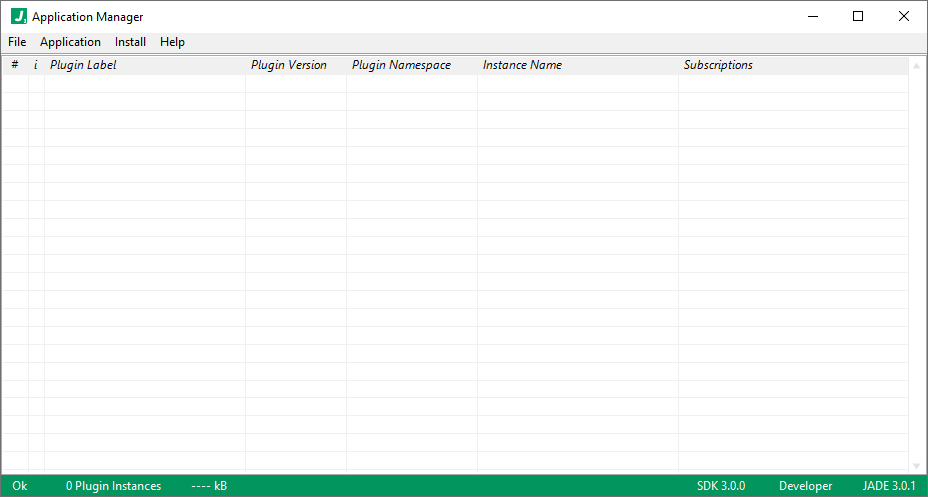
You may now close the activation window and being using JADE. An empty Application Manager window will open:
Install JADE Bundle

Now let’s install the “All Latest” bundle we downloaded previously. This bundle contains all the plugins we’ll need for the moment. The easiest way to do this is to simply double-click the JADE Bundle icon:

After double-clicking on it, the Install Manager will open and begin installing the bundle:
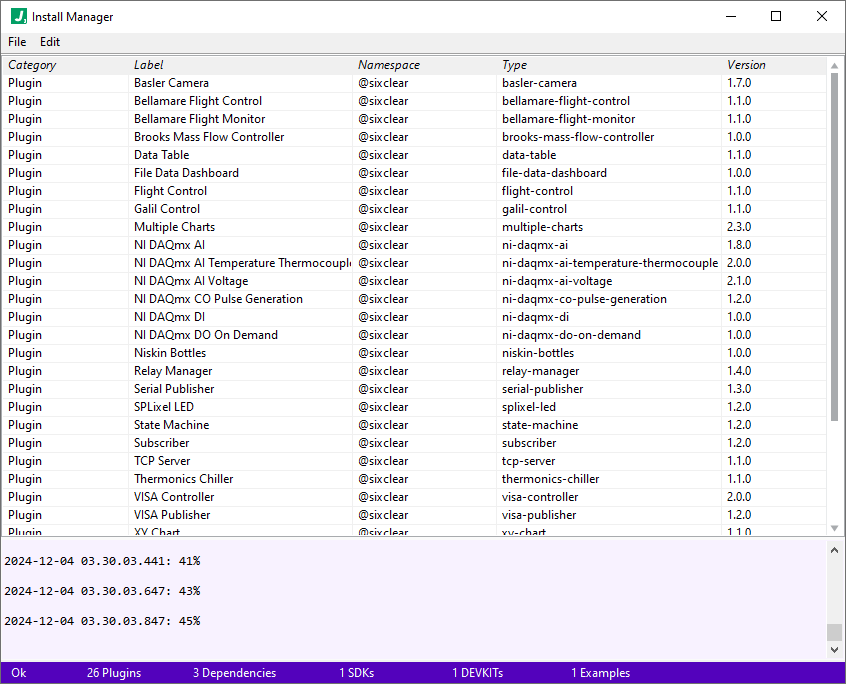
Note: alternatively, we could have initiated the bundle installation by opening the Install Manager from the Install > Install Manager... menu option in Application Manager, and then using the File > Install Bundle... menu option in the Install Manager.

When the installation completes you’ll see a success dialog. If may indicate that you need to restart your computer if drivers were installed.

And upon closing it you’ll see the log color return to neutral indicating completion:
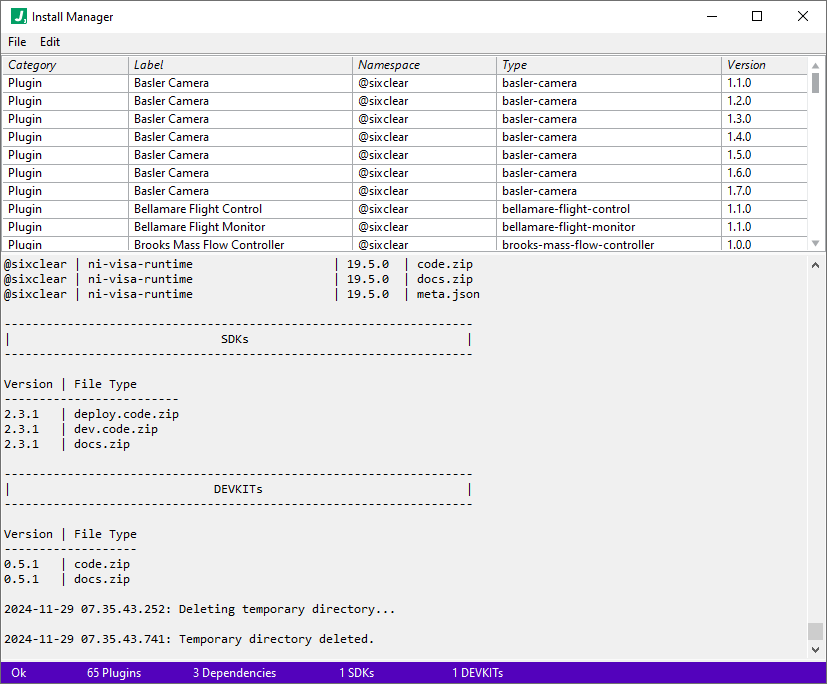
At this point, we have everything installed that we need to build and run applications in JADE!

Run An Example

Examples are a powerful way to both learn about features and start applications in JADE. Let’s start by saving a copy of the example named Acquire, Log, and Plot Sensor Data with VISA (which was installed with our “All Latest” bundle).

Note: In JADE, we don’t modify installed examples directly. Instead, we first make copies of the examples before editing or running them. This keeps the installed examples pristine and you can always return to them to make fresh copies. We can view installed examples, and make a copy, from the Install Manager or download them from the JADE Docs.

Open the Install Manager (if not already) and locate the example Acquire, Log, and Plot Sensor Data with VISA. Select it, right-click, and choose the option to Copy selected examples...
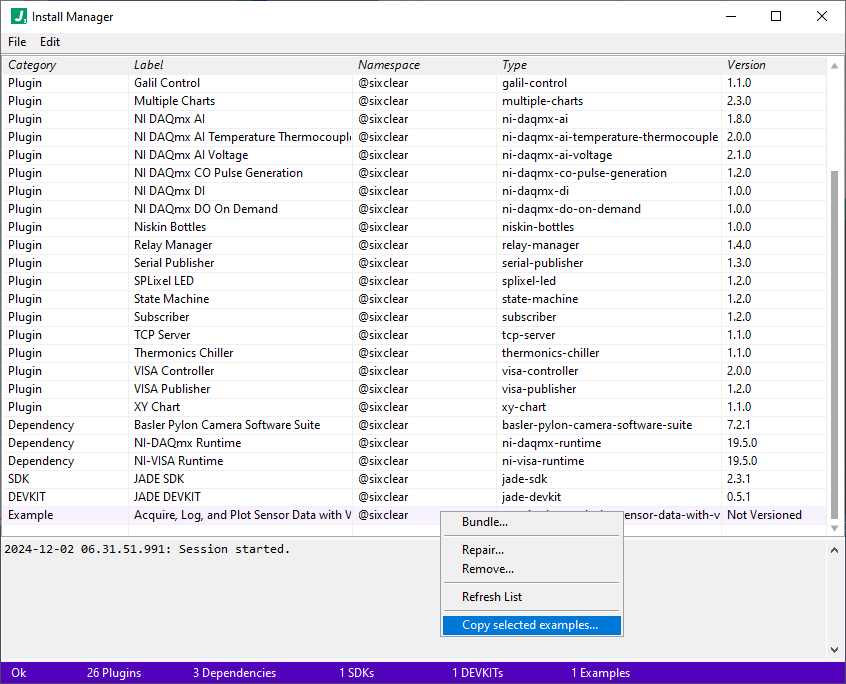
When prompted, save the example to your desired location. This will save a JADA file named acquire-log-and-plot-sensor-data-with-visa.jada. If you’re seeing the file on disk, you’ll see an icon like the following:

Next, open that JADA file by either double-clicking on it or using the File >> Open... menu in JADE and run it with the Application > Run Application menu option. You should then see 3 windows open where we have arranged them manually as seen below:
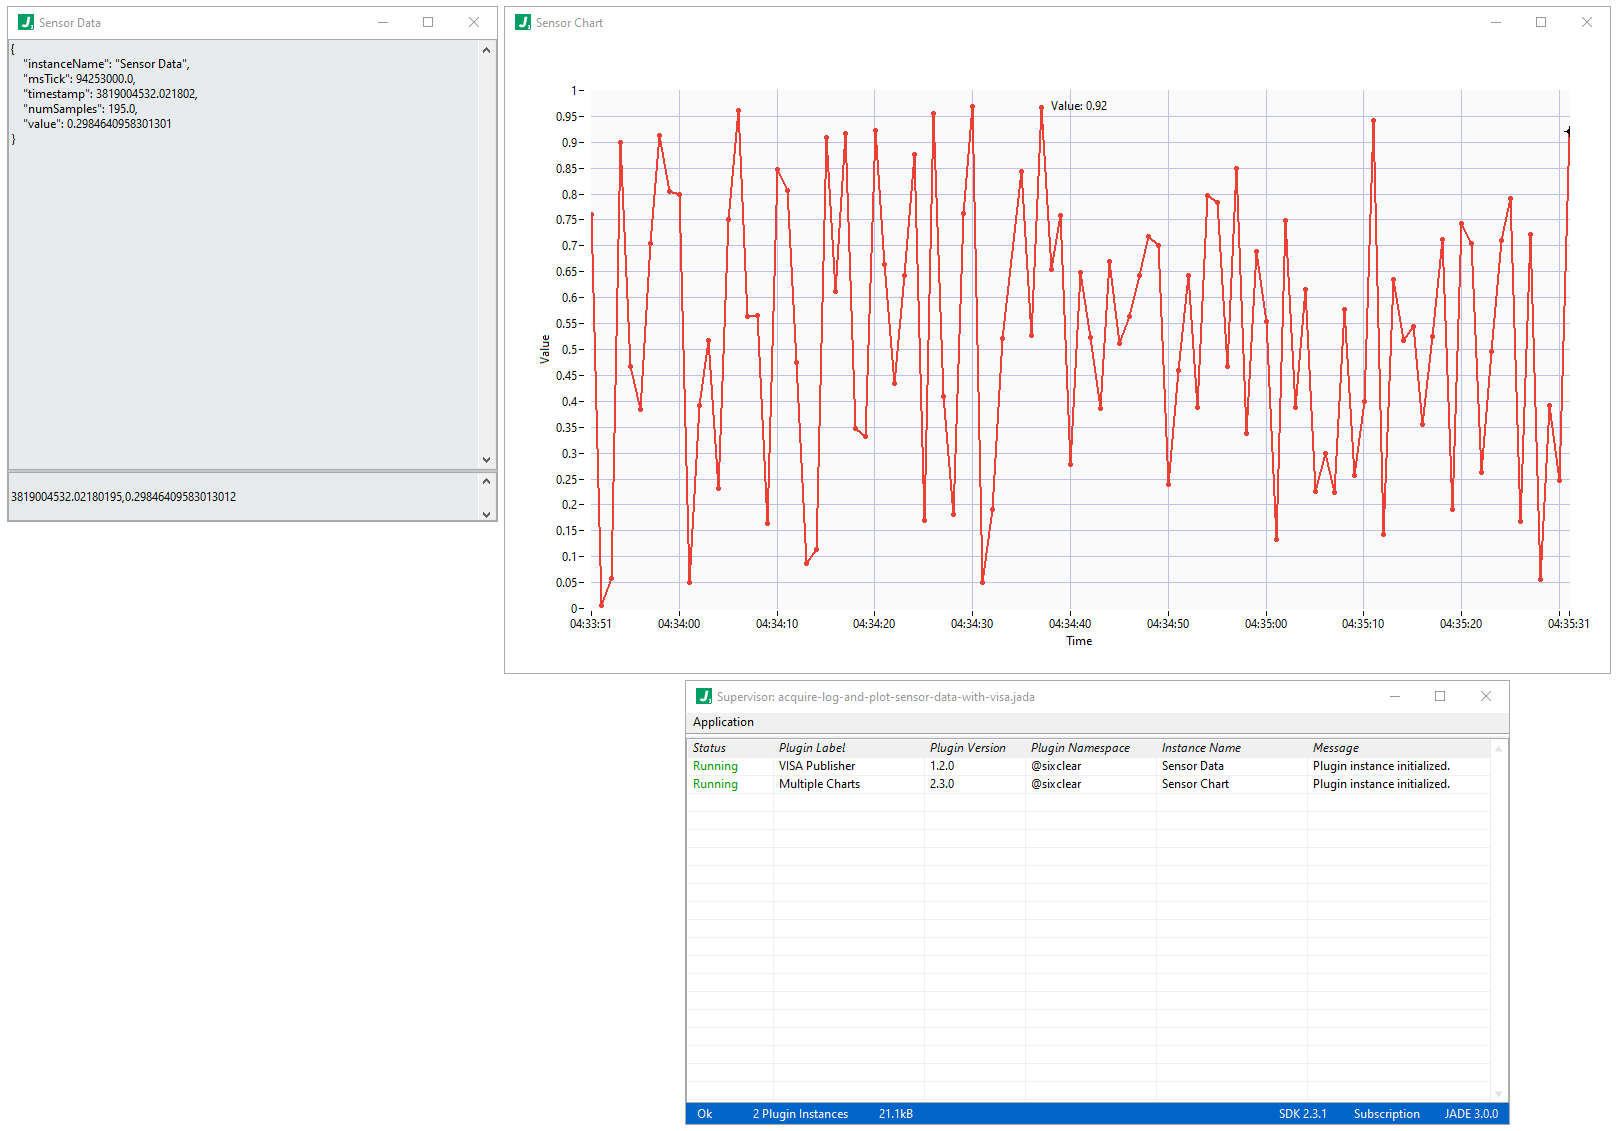
To explore the example in more detail, head over to the docs for this example.

Create An Application From Scratch

Now let’s create our own JADE application from scratch: a simple application with a VISA Publisher instance (acquires, logs, publishes, and displays data) and Multiple Charts plugin to visualize the data in a graph. We’ll then see how this simple exmaple extends to more sophisticated applications.

If you have an application already open in JADE, choose File >> New to start fresh.

Now let’s add our VISA Publisher instance and Multiple Charts instance.

With both of our plugins added, this is how the Application Manager should look:

VISA Publisher Configuration

Let’s first work on the VISA Publisher configuration. To start, right-click on the VISA Publisher instancea and choose Edit....

This will open the plugin configuration editor for the VISA Publisher instance. In the image below we have highlighted (in red boxes) areas of interest which we’ll discuss further below:

Plugin Instance Name

To change the name of a plugin instance, we can simply click on the text at the top of the editor to begin editing the name. Because it was the first plugin instance added since we started JADE, the instance name defaults to Untitled Plugin Instance 1. Let’s change it to Instrument Data as shown below:

Notice that the name changes in both the editor (foreground window) and the Application Manager window (background window) under the Instance Name column. We have highlighted both with a red box to emphasize this.

Connection Configuration & Simulation Mode

Here we focus on the simulationMode key within the connectinConfiguration object which captures how to connect to a sensor, instrument, or other device using VISA. Since we’ll be simulating a device at the moment, notice that the SimluationMode is set to true. Simluaton mode is supported at the connection management layer in the underlying JADE SDK, which is why we find it here under the connectionConfiguration object:

{
    // ...

        "conectionConfiguration": {
            "Type": "Serial",
            "SimulationMode": true,
            "Address": "COM1",
            "Timeout": 2000,
            "TerminationEnable": true,
            "TerminationCharacter": "\n",
            "TrimResponseWhiteSpace": true,
            "BytesToRead": 1000,
            "BaudRate": 9600,
            "DataBits": 8,
            "StopBits": "1.0",
            "Parity": "None",
            "FlowControl": "None",
            "ReadToFileEnable": false,
            "ReadToFilePath": "",
            "ReadToFileAppendEnable": true,
            "ReadToFileReturnData": true,
            "DuplicateSession": false,
            "AccessMode": "VISA Defaults"
        }

    // ...
}

Owining to simluation support at the connection management layer in JADE SDK, simulation mode is built into almost all JADE plugins capable of interfacing with hardware, so that systems can be developed, tested, and validated - to the extent possible - before running against live hardware.

Simulation Response

Notice that the simulationResponse is set to RAND(0,1). RAND is a function provided in the JADE Expression lanaguage which returns a random number between the provided parameters (in this case 0 and 1) using a uniform probability distribution. This is just one of many functions provided.

{
    // ...

        "simulationResponse": "RAND(0,1)",

    // ...
}

Response Regex

Notice that the responseRegex is set to (.+). This is a regular expression which defines how to parse the response received from the device.

{
    // ...

        "responseRegex": "(.*)",

    // ...
}

More specifically, parentheses in a regular expression indicates a Capture Group. Generally, using multiple capture groups allows a single regular expression to “pluck out” multiple parts of a string. In this case, since we expect just a single number form the instrument (based on the simulation response), we choose here to capture “the entire string” using the expression .+ inside our capture group parentheses. The . matches any single chracter and the + matches one or more occurrances of the preceding expression or subexpression. As we’ll see in the coming sections here, we wll have access to the parsed data for both publishing data (for consumption by other plugins) and logging data to file. Check out our regular expresssions introduction for more information and examples.

Publish Data Format

The publishDataFormat is an object which defines the data format published by the plugin. Data is published as it is received, either via the writeCommand along with the writeCommandPeriod, or at the frequency received by a device such as a sensor or instrument which simply publishes data to the port without the need for querying (set writeCommand equal to false in such case).

{
    // ...

        "publishDataFormat": {
            "instanceName": "@VAR{instanceName}",
            "msTick": "Integer:(@VAR{msTick})",
            "timestamp": "Float:(@VAR{timestamp})",
            "numSamples": "Integer:(@VAR{numSamples})",
            "value": "Float:(@VAR{submatch[0]})"
        }

    // ...
}

Importantly here, notice the value key within the publishDataFormat object. The Float:(// ...) here is JADE expression language syntax which indicates the expression inside should be intepreted as a floating point value. Inside that syntax we see @VAR{submatch[0]} defining the data type of the value to be float, as well as variable syntax for how to access data parsed by the responseRegex.

All capture groups are put into a submatch array. submatch[0] then indexes out the first capture group’s value (in this case the only value because we only defined a single capture group in our regex). The wrapping @VAR{...} syntax is just standard JADE variable syntax, where VAR refers to the name of the variable container in which this plugin exposes the parsed data. For more information on expressions, see the JADE Expression Lanauge Syntax Reference.

As we shall see, this data can be consumed by other plugins, such as a Multiple Charts plugin instance which we’ll show in the sections to follow.

Multiple Charts Configuration

Next we’ll focus on the multiple charts configuration. What we’ll find is that we can subscribe to the Instrument Data plugin, handle its incoming data (even performing computations if desired), and then plot the data. Of course, we’ll also give this plugin instance a more semantic name.

Plugin Instance Name

Just like we did for our VISA Publisher instance above, we can rename our Multiple Charts plugin instance. Let’s open the configuration editor for our Multiple Charts instance and enter the name: Data Charts. As the name implies, we’ll eventually add more than one chart to see just how easy it is to lay out multiple charts.

Subscribing to Published Data

Subscribing to data is easy; simply add the instance name of the plugin(s) from which we wish to receive data to SubscribesTo array.

{
    // ...

    "subscribesTo": [
        "Instrument Data"
    ]

    // ...
}

Handling Subscription Data

Let’s see how we handle incoming subscription data (which will be available in a SUB variable container), and more generally how we can compute and store values into this plugin’s VAR variable container. Under options we find the computations object with 3 subobjects, something like shown below:


{
    // ...

        "computations": {
            "initializations": {
                "exmapleVar1": 10,
                "exmapleVar2": "kitty"
            },
            "subscriptions": {
                "My Plugin Instance": {}
            },
            "intermediates": []

        }
        
    // ...
}

The initializations subobject is where we can specify initial values for the VAR container. Keys are variable names and values are the values of the variables.

The subscriptions suboject is where we specify computations triggered by incoming subscription data on per-plugin basis. The child keys under this subobject should be plugin instance names, matching those we have in our subscribesTo section above. The corresponding values for those child keys will be objects containing key/value pairs which assign values from the SUB variable container which holds the incoming subscription data.

The intermediates subobject is where we specify computations which are run right after subscription data is handled from any plugin. intermediates is an array of objects, where each object has keys / value pairs corresponding to variable names and values. Since JSON does not distinguish the processing order of keys within an object, we cannot depend on the order of the keys to determine order of computation. With that in mind, use multiple objects here if you need to sequence computations as the objects are processed in the order defined in the array. The intermediates object is helpful when computations should be performed against data received from multiple sources.

Now let’s modify the computations configuration. Our goal is to eventually have 3 plots, so we’ll eventually compute 3 values: value1, value2, and value3.

  • First, for our purposes here we don’t need any initial values so we remove the sample / default contents (exampleVar and exampleVar2) found in the initializations object to start.

  • Next, let’s handle the data we’ll receive from our Instrument Data plugin instance by setting a variable named value1 equal to the incoming subscription value. More specifically, notice under subscriptions we have a key named Instrument Data, under which we define a timestamp to be equal to the timestampe received by the Instrument Data plugin, and a value1 to be equal to the value received by the Instrument Data plugin. We access that received timestamp and value in the SUB variable container as @SUB{value}.

  • Finally, let’s compute a trivial value2 equal to 2*@VAR{vaue1} and value3 equal to 3*@VAR{value} under intermediates. Since we’re only subscribed to a single plugin instance here, we could have computed this under the subscriptions subobject as 2*@SUB{value} and 3*@SUB{value} respectively, but we show choose to show the intermediates section here for completion.

All three of the edits noted above are represented in the snippet below:

{
    // ...

        "computations": {
            "initializations": {},
            "subscriptions": {
                "Instrument Data": {
                    "timestamp": "Float:( @SUB{timestamp} )",
                    "value1": "Float:( @SUB{value} )"
                }
            },
            "intermediates": [
                {
                    "value2": "Float:( 2*@VAR{value1} )",   
                    "value3": "Float:( 3*@VAR{value1} )"   
                }
                
            ]
        }

    // ...
}

We’re now ready to configure some charts to display the variables value, value2, and value3 computed above, and lay out our charts in a grid.

Configuring Charts

We’ll keep our charts configuration pretty simple, although it’s notable that the Multiple Charts plugin provides fairly deep control over chart rendering. For now, let’s expand the charts option in configuration and observe that it has a single chart already defined named MyChart:

Note: we have collapsed down some subojects in this configuration section so that it’s easier to see the overall structure of this bit of configuration.

{
    // ...

        "charts": {
            "MyChart": {/* ... */}
        }

    // ...
}

Let’s rename MyChart to MyChart1 since we’ll eventually have 3 charts:

{
    // ...

        "charts": {
            "MyChart1": {/* ... */},
        }

    // ...
}

Now, inside the MyChart1 object, find the plots element and observe that it is an array of objects with a single object already defined in it as a sample to help us get started. In general, each such object defines a plot to put into this chart.

{
    // ...

        "charts": {
            "MyChart1": {
                "properties": {/* ... */},
                "plots": [
                    {
                        "name": "Value",
                        "historyLength": 100,
                        "data": {
                            "x": "Float:(@VAR{timestamp})",
                            "y": "Float:(@VAR{value})"
                        },
                        "properties": {/* ... */},
                        "annotation": {/* ... */}
                    }
                ]
            }
        }

    // ...
}

Now zoom into the data element within the plot object, which allows us to define an (x,y) point to plot. What we desire here is for the x value to be our timestamp, and the y-coordinate to be our value1. In this case, the sample data already has our timestamp syntax correct, but we need to update the y value. Here’s the finished product:

{
    // ...

        "charts": {
            "MyChart1": {
                "properties": {/* ... */},
                "plots": [
                    {
                        "name": "Value",
                        "historyLength": 100,
                        "data": {
                            "x": "Float:(@VAR{timestamp})",
                            "y": "Float:(@VAR{value1})"
                        },
                        "properties": {/* ... */},
                        "annotation": {/* ... */}
                    }
                ]
            }
        }

    // ...
}

Notably, data is plotted at the period specified by the samplePeriod configuration (see the top of the options section) using the current values in the VAR container. The default samplePeriod is 1000 milliseconds (1 second).

Now, to create our other 2 charts, we can simply copy our MyCharts1 a couple of times to create MyChart2 and MyChart3, and update the y values to value2 and value3 respectively, so that we end up with:

{
    // ...

        "charts": {
            "MyChart1": {
                "properties": {/* ... */},
                "plots": [
                    {
                        "name": "Value",
                        "historyLength": 100,
                        "data": {
                            "x": "Float:(@VAR{timestamp})",
                            "y": "Float:(@VAR{value1})"
                        },
                        "properties": {/* ... */},
                        "annotation": {/* ... */}
                    }
                ]
            },
            "MyChart2": {
                "properties": {/* ... */},
                "plots": [
                    {
                        "name": "Value",
                        "historyLength": 100,
                        "data": {
                            "x": "Float:(@VAR{timestamp})",
                            "y": "Float:(@VAR{value2})"
                        },
                        "properties": {/* ... */},
                        "annotation": {/* ... */}
                    }
                ]
            },
            "MyChart3": {
                "properties": {/* ... */},
                "plots": [
                    {
                        "name": "Value",
                        "historyLength": 100,
                        "data": {
                            "x": "Float:(@VAR{timestamp})",
                            "y": "Float:(@VAR{value3})"
                        },
                        "properties": {/* ... */},
                        "annotation": {/* ... */}
                    }
                ]
            }
        }

    // ...
}

At this point we have 3 charts configured to show our data. Next we’ll lay them out in a grid.

Laying Out Charts in a Grid

Let’s now focus on the grid configuration, and in particular the layout array within:

{
    // ...

        "grid": {
            "outerMargins": {/* ... */},
            "innerGaps": {/* ... */},
            "layout": [
                []
            ]
        }

    // ...
}

By default, the layout array is effectively empty, though it’s implied structure is a 2D array, or an array of arrays. As we shall see momentarily, we can use our chart names MyChart1, MyChart2, and MyChart3 here.

But first, take note that the outer flat brackets represent the outer array, and each set of inner flat brackets we define will represent a row. They give us one empty “row” (set of inner flat brackets) as a hint. Each row, however, can contain chart names to lay out in that row.

Let’s put our first two charts side by side in the top row, and our third chart in the second row as follows:

{
    // ...

        "grid": {
            "outerMargins": {/* ... */},
            "innerGaps": {/* ... */},
            "layout": [
                ["MyChart1", "MyChart2"],
                ["MyChart3"]
            ]
        }

    // ...
}

And if we wanted to resize the widths of the charts in the first row, perhaps setting them to consume 65% and 35% of the horizontal space respectively, we can use syntax like:

{
    // ...

        "grid": {
            "outerMargins": {/* ... */},
            "innerGaps": {/* ... */},
            "layout": [
                ["MyChart1 (w=65%)", "MyChart2 (w=35%)"],
                ["MyChart3"]
            ]
        }

    // ...
}

We are now ready to save and run our application.

Saving & Running Our Application

To ensure both of our plugins run “automatically” when we run the application, be sure to check the checkboxes next to both plugins:

Then save our application as MyApplication.jada by using File >> Save... in the Application Manager window.

And finally, just like we ran our example above, choose Application >> Run Application from the menu in the Application Manager window to run our application. You should then see 3 windows (Instrument Data, Data Charts, and Supervisor) which we have manually arranged as follows here:

To stop your application, you can simply click the red X in the upper right of the Supervisor window. While there’s much more we can do, including controlling individual plugins, we’ll stop here with this getting started tutorial and defer additional feature exploration to other docs. To learn more about creating your own plugins, check out our DEVKIT documentation.

Summary

If you’ve made it this far, congratulations! You’ve now installed JADE, run an example, and created your own application from scratch. While plugins tend to have deep configuration, they also have deep documentation to help you along. And of course the deep plugin configuration is always there to save you from hours of writing, debugging, and maintaining loads of irreducible code to get the capabilities and features you need in your applications. Notably, we also create examples for each plugin