Overview
This example demonstrates how to acquire, log, and plot data using the VISA Publisher plugin and the Multiple Charts plugin.
The VISA Publisher will run in simulation mode so no hardware is required. The VISA Publisher plugin allows us to collect data from sensors connected to essentially any peripheral port (ex. Serial, Ethernet, USB, GPIB, etc.). If you are using a raw data acquisition device, such as an NI data acquisition device, see the Acquire, Log, and Plot Sensor Data with NI Data Acquisition example which uses the NI DAQmx AI plugin instead of the VISA Publisher plugin.
User Interface
Let’s break down everything we’ll see in the interface when opening and running this example.
JADE Manager
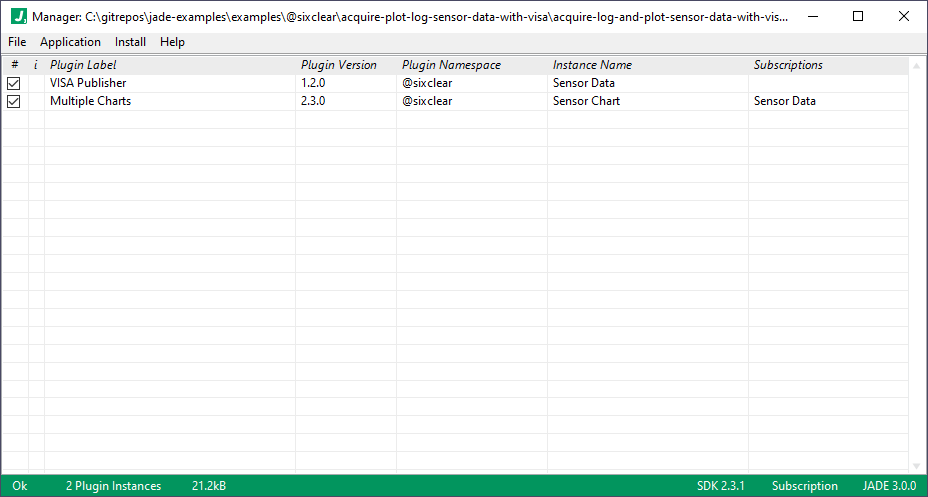
First, when we open the example we’ll see the two plugin instances populated in the JADE Manager:
JADE Supervisor
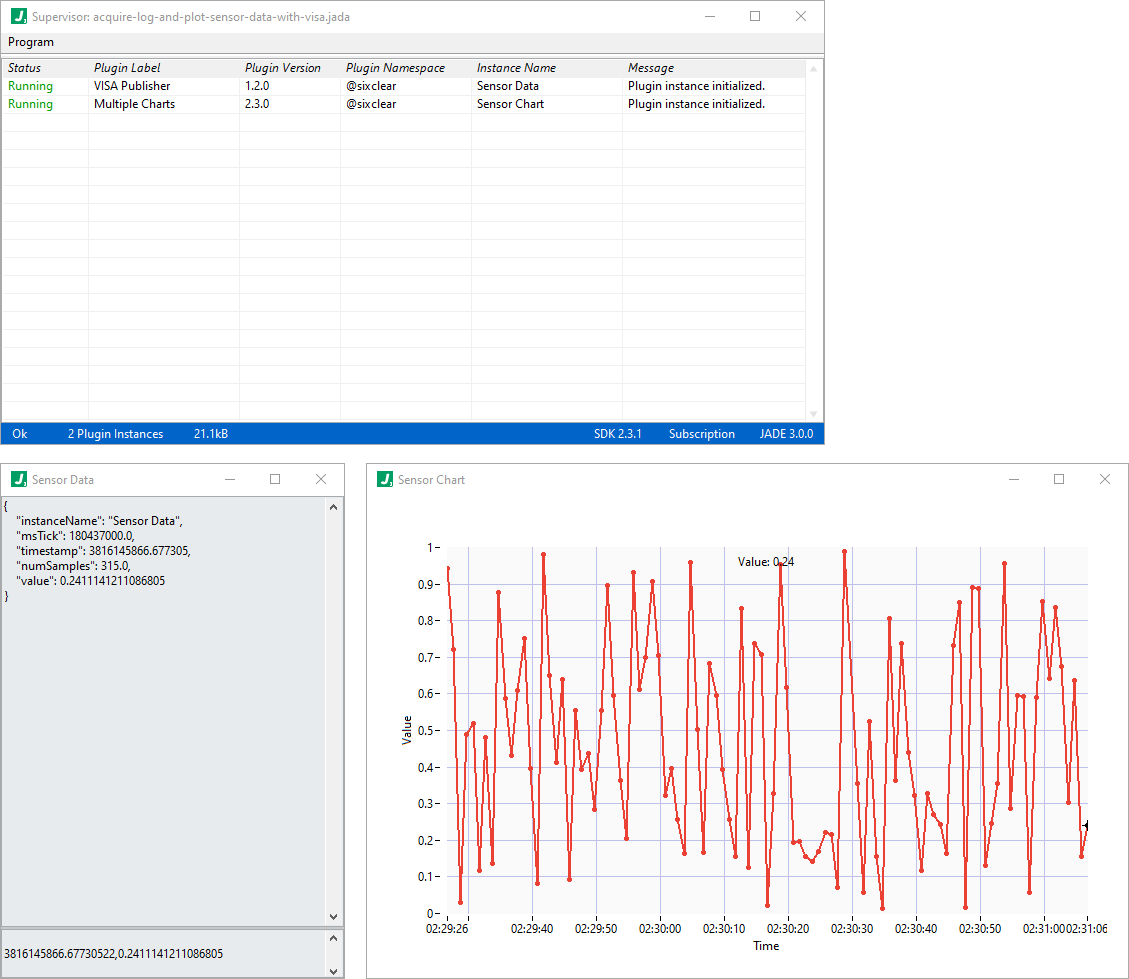
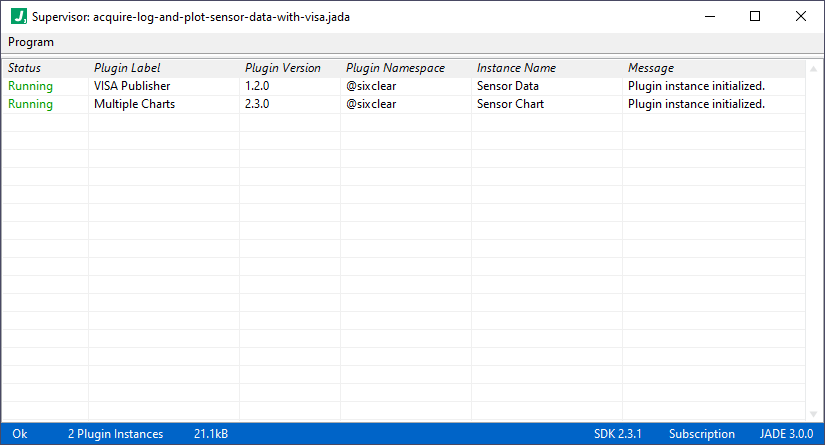
When we run the application, we see the Supervisor:
VISA Publisher Plugin Instance: Sensor Data
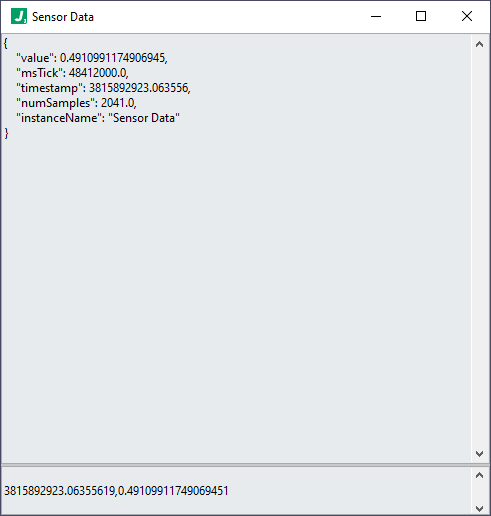
The VISA Publisher plugin interface also displays (panel configured to show when run), which shows the data collected & published from the sensor (top section of its interface) as well as the log string (configured as CSV in this case; bottom section of its interface):
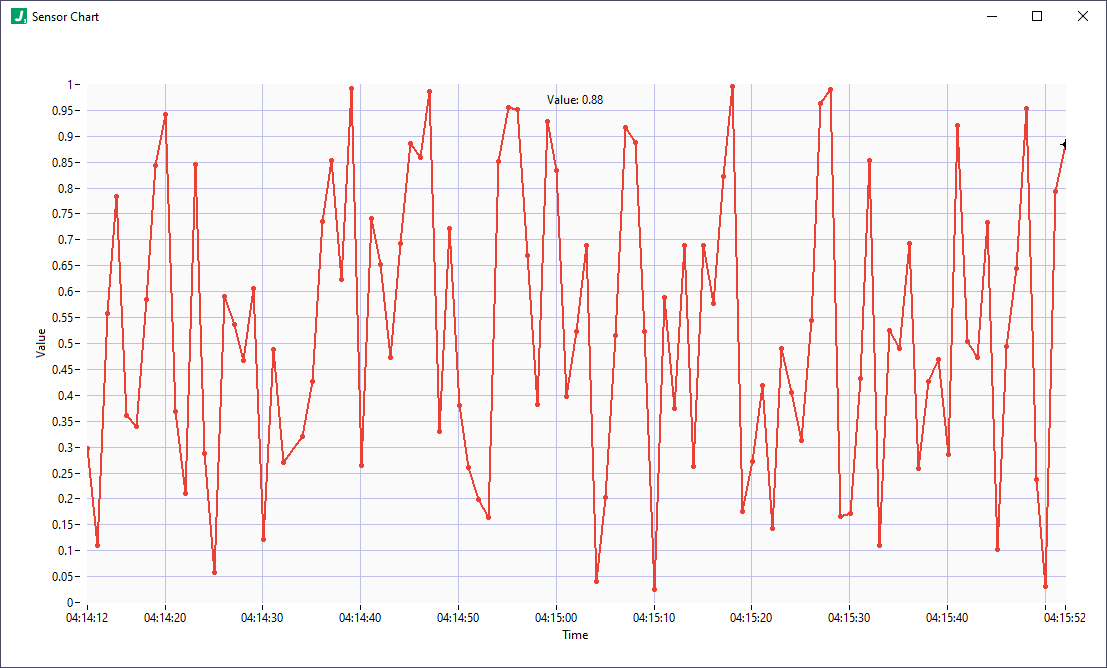
Multiple Charts Plugin Instance: Sensor Chart
The Multiple Charts plugin interface also displays (panel configured to show when run) which shows the single chart we defined for this example to render the sensor data:
Key Configuration Details
In this simple example, the VISA Publisher plugin runs in simulation mode and publishes a random value between 0 and 1 at 1 Hz, which is consumed and displayed by our Multiple Charts plugin. In this section we’ll break down the key bits of configuration for those plugins used in this example.
VISA Publisher Plugin Instance: Sensor Data
We simply used the default configuration for the VISA Publisher initially, however we could easily turn off simulation mode and update the port connection information.
Configuring Connection Info & Simulation Mode
Below is the connectionConfiguration configuration for the VISA Publisher where notice the SimulationMode is set to true:
{
    "options": {
        //...
        "simulationLoopDelay": 1000,
        "simulationResponse": "RAND(0,1)",
        "responseRegex": "(.+)",
        //...
        "publishDataFormat": {
            //...
        },
        //...
        "connectionConfiguration": {
            "Type": "Serial",
            "SimulationMode": true, // <-- LINE OF INTEREST
            "Address": "COM1",
            "Timeout": 2000,
            "TerminationEnable": true,
            "TerminationCharacter": "\n",
            "TrimResponseWhiteSpace": true,
            "BytesToRead": 1000,
            "BaudRate": 9600,
            "DataBits": 8,
            "StopBits": "1.0",
            "Parity": "None",
            "FlowControl": "None",
            "ReadToFileEnable": false,
            "ReadToFilePath": "",
            "ReadToFileAppendEnable": true,
            "ReadToFileReturnData": true,
            "DuplicateSession": false,
            "AccessMode": "VISA Defaults"
        },
        "logger": {
            //...
        }
        //...
    },
    "panel": {
        //...
    },
    "channel": {
        //...
    }
}
Handling Data & Simulation Details
Next, let’s focus on the simluationLoopDelay, simulationResponse, and responseRegex elements:
{
    "options": {
         //...
        "simulationLoopDelay": 1000, // <-- LINE OF INTEREST
        "simulationResponse": "RAND(0,1)", // <-- LINE OF INTEREST
        "responseRegex": "(.+)", // <-- LINE OF INTEREST
         //...
        "publishDataFormat": {
            //...
        },
         //...
        "connectionConfiguration": {
            //...
        },
        "logger": {
            //...
        }
         //...
    },
    "panel": {
        //...
    },
    "channel": {
        //...
    }
}
Notice the simulationResponse configuration is set to RAND(0,1) to generate a random number between 0 and 1. This simulates the value returned by the sensor. Some sensors return more than one value, but we keep it simple for this example.
In order to process this incoming data, we specify a regular expression with the responseRegex which is configured to be (.+) which simply matches 1 or more characters where the outer parentheses captures the matched content. We would make this regular expression more sophisticated if more data was returned by this sensor, but this suffices for this example.
The simulationLoopDelay is set to 1000 (a value in milliseconds) so that publishing occurs at 1 Hz. Generally the VISA Publisher plugin publishes data as it arrives, matching the actual sampling rate of the sensor.
Defining Data to Publish
Finally, let’s also look at the publishDataFormat and specifically its value element:
{
    "options": {
         //...
        "simulationLoopDelay": 1000,
        "simulationResponse": "RAND(0,1)",
        "responseRegex": "(.+)",
         //...
        "publishDataFormat": {
            "instanceName": "@VAR{instanceName}",
            "msTick": "Integer:(@VAR{msTick})",
            "timestamp": "Float:(@VAR{timestamp})",
            "numSamples": "Integer:(@VAR{numSamples})",
            "value": "Float:(@VAR{submatch[0]})" // <-- LINE OF INTEREST
        },
         //...
        "connectionConfiguration": {
            //...
        },
        "logger": {
            //...
        }
         //...
    },
    "panel": {
        //...
    },
    "channel": {
        //...
    }
}
Observe that the publishDataFormat is JSON. This makes it easy for subscribers, such as our Multiple Charts plugin instance, to consume the data.
Next, let’s notice that the value within the publishDataFormat is set to Float:(@VAR{submatch[0]}) which is the captured number acquired from the sensor. This bit of syntax has two key parts:
-
The
@VAR{submatch[0]}part is a variable which resolves to the value captured by the regular expression. Thesubmatchvariable is always provided by this plugin as an array of the matches to ourresponseRegex, where the matches correspond to our parenthetical groups in the regular expression. If we had captured multiple values, there would be othersubmatchvalues and we would use indexes beyond0. -
The
Float:(...)part instructs JADE to interpret the value inside parentheses as a floating point value. This effectively ensures that that the published JSON will not use quotes"around the value (i.e. treating it as anumbertype in JSON vs astringtype).
Here’s an example of the published data copied directly from the VISA Publisher plugin interface, where we see how the other variables used in the publishDataFormat resolve:
{
    "value": 0.2900404374107213,
    "msTick": 50078001.0,
    "timestamp": 3815894589.064518,
    "numSamples": 3706.0,
    "instanceName": "Sensor Data"
}
Formatting Log File Data
Finally, let’s take a look at the logger configuration and the resulting file data. Below is the logger configuration where we observe that the StartLogFormat is set to Timestamp,Value and the LogMessageFormat is set to \n@VAR{timestamp},@PUB{value}. This sets up the logger to log CSV:notice the comma between the @VAR{timestamp} and @VAR{value}.
{
    "options": {
         //...
        "simulationLoopDelay": 1000,
        "simulationResponse": "RAND(0,1)",
         //...
        "responseRegex": "(.+)",
         //...
        "publishDataFormat": {
            //...
        },
         //...
        "connectionConfiguration": {
            //...
        },
        "logger": {
            "Enable": true,
            "LogFolder": "<Desktop>\\JADE_LOGS\\@VAR{instanceName}",
            "FileNameFormat": "@VAR{instanceName}-@LOG{TIMESTAMP}.csv",
            "ErrorsOnly": false,
            "DiskThrashPeriod": 1000,
            "FileSizeLimit": 1000000,
            "StartLogFormat": "Timestamp,Value", // <-- LINE OF INTEREST
            "EndLogFormat": "",
            "LogEntryFormat": "@LOG{LOGMESSAGE}",
            "LogMessageFormat": "\n@PUB{timestamp},@PUB{value}", // <-- LINE OF INTEREST
            "ErrorLogEntryFormat": "@LOG{ERRORMESSAGE}",
            "TimestampFormat": "%Y-%m-%d %H-%M-%S%3u"
        }
         //...
    },
    "panel": {
        //...
    },
    "channel": {
        //...
    }
}
The StartLogFormat is written just once initially for the column headers and the LogMessageFormat is processed and written as data is acquired. Notice that we use the @PUB{} variable container here which allows us to log the timestamp and value data corresponding to our publishDataFormat. This is actually quite useful because we can perform computations against the data there, although we did not in this case to focues on more fundamental concepts. Finally, observe the leading \n in the LogMessageFormat which adds a line feed character before each set of data is written on a new line as desired for a CSV format.
Here’s a snippet of the data file written to the location specified by the LogFolder and FileNameFormat configuration elements (where new files are generated according to the FileSizeLimit):
Timestamp,Value
3815890883.06504392,0.9722754721357747
3815890884.06391811,0.99767884692889297
3815890885.06505918,0.37957011915279581
3815890886.06387901,0.5873585864974088
3815890887.06395721,0.80676089293212561
3815890888.06388998,0.37698209303595348
3815890889.06404495,0.13959443893675161
3815890890.096879,0.7238782201641496
3815890891.06387615,0.39061802309040311
3815890892.0650382,0.12027792162107589
3815890893.08587694,0.96430180927806808
3815890894.06309891,0.40716065444030919
3815890895.06397676,0.80932448175348926
3815890896.10087299,0.85499303856817344
3815890897.06396723,0.6078681294395829
3815890898.06494999,0.91876784103867193
3815890899.06498718,0.31241416300144359
The timestamp format here is numeric, but we could have used any timestamp format.
Multiple Charts Plugin Instance: Sensor Chart
Now let’s break down key aspects of the Multiple Charts plugin configuration, which subscribes to the VISA Publisher instance and plots the data in a single chart. The configuration for this plugin is deep because it exposes the ability to independently configure many features such as chart titles, x and y axis labels, annotation labels, computations against the incoming data, the number of charts and the layout for those charts (in this case just one chart), the plots per chart, and more.
Subscribing to the VISA Publisher Plugin Instance
First, we must subscribe to the VISA Publisher instance, whose instance name in this case was set to Sensor Data. We do this with the subscribesTo element, which is an array of plugin instance names:
{
    "subscribesTo": [
        "Sensor Data" // <-- LINE OF INTEREST
    ],
    "options": {
        //...
    },
    "panel": {
        //...
    },
    "channel": {
        //...
    }
}
Defining Charts
Now, the configuration for the chart is rich, but let’s focus on just the key aspects. First we created a chart named MyChart under the charts configuration object:
{
    "subscribesTo": [
        "Sensor Data"
    ],
    "options": {
        "samplePeriod": 1000, // <-- LINE OF INTEREST
        //...
        "computations": {
            "initializations": {},
            "subscriptions": {
                "Sensor Data": {
                    "timestamp": "@SUB{timestamp}", // <-- LINE OF INTEREST
                    "value": "@SUB{value}" // <-- LINE OF INTEREST
                }
            },
            "intermediates": []
        },
        "grid": {
            "outerMargins": {
                //...
            },
            "innerGaps": {
                //...
            },
            "layout": [
                ["MyChart"] // <-- LINE OF INTEREST
            ]
        },
        "charts": {
            "MyChart": {
                "properties": {
                    //...
                },
                "plots": [
                    {
                        "name": "Value",
                        "historyLength": 100,
                        "data": {
                            "x": "Float:(@VAR{timestamp})", // <-- LINE OF INTEREST
                            "y": "Float:(@VAR{value})" // <-- LINE OF INTEREST
                        },
                        "properties": {
                            //...
                        },
                        "annotation": {
                            //...
                        }
                    }
                ]
            }
        },
        "logger": {
            //...
        }
    },
    "panel": {
        //...
    },
    "channel": {
        //...
    }
}
First, notice the computations element. This is where we handle incoming data and perform computations. Under it we have a subscriptions element which allows us to handle incoming subscription data directly as it arrives. Under that element we have a Sensor Data key which is the instance name of our VISA Publisher plugin instance. This is where we put the computations to handle when data arrives from that plugin instance specifically. Finally there, we see that we handle two of the incoming subscription data bits: @SUB{timestamp} and @SUB{value} variables. We assign them to timestamp and value variables there respectively, and any computations performed here will end up in the @VAR{} variable container for use elsewhere in configuration.
With that in mind, we can now turn our attention to the plots element, whch is an array of plot objects. We define a single plot object here. Now focus on the data element of the plot object, which defines the data for the plot. It sets the x coordinate to the published timestamp and the y coordinate to the published value to form points. That is, each time data arrives we perform the subscription computations, which put data into our @VAR{} data container as previously noted. Then, at the configured samplePeriod (in this case set to 1000 milliseconds, or 1 second), a point (x,y) is constructed and plotted according to the latest values.
Adding Annotations to Charts
Next, let’s see how we can add annotations to the chart.
{
    "subscribesTo": [
        "Sensor Data"
    ],
    "options": {
        "samplePeriod": 1000,
        //..
        "computations": {
            //...
        },
        "intermediates": []
        },
        "grid": {
            //...
         },
        "charts": {
            "MyChart": {
                "properties": {
                    //...
                },
                "plots": [
                    {
                        "name": "Value",
                        "historyLength": 100,
                        "data": {
                            //...
                        },
                        "properties": {
                            //...
                        },
                        "annotation": {
                            "enable": true,
                             //...
                            "label": {
                                "template": "Value: @PLOT{yValue}", // <-- LINE OF INTEREST
                                "anchorPosition":"TopCenter", // <-- LINE OF INTEREST
                                "xValueFormat": "%.2f",
                                "yValueFormat": "%.2f",
                                "padding": {"x": 0, "y": 10}
                            }
                        }
                    }
                ]
            }
        },
        "logger": {
            //...
        }
    },
    "panel": {
        //...
    },
    "channel": {
        //...
    }
}
Notice the annotation configuration in our plot object which has a template defined as Value: @PLOT{yValue}. This defines how the annotation will display on the chart. The @PLOT{yValue} is a variable which gets replaced with the yValue of the most recently plotted point. Also notice that the anchorPosition is TopCenter which determines where on the chart the annotation displays.
Summary
There are two big takeaways from this example. First, with just a bit of configuration we can very quickly acquire, log, and display data. Second, the configuration is often quite rich so that the same plugins can be used in many applications. Investing a bit of time in understanding the configuration for such plugins will help you create full-featured applications quickly.
Related Links
Check out the following links for more information on topics related to this example.
Platform
- JSON Intro
- Regex Intro
- JADE Expression Language
- List of Functions
- Symbolic Path Notation
- Format String Syntax
Examples